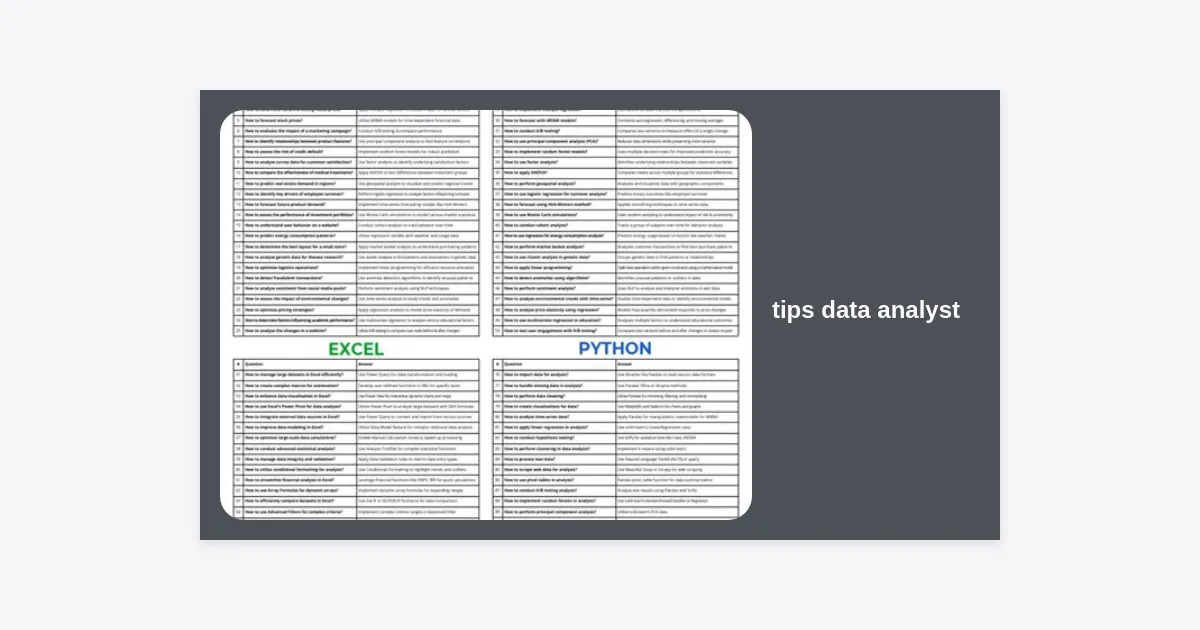
In an era where data is often called the “new oil,” the role of a data analyst has become one of the most pivotal positions in modern business. However, transitioning from a beginner to a high-impact professional requires more than just knowing how to write code. Successful professionals constantly seek the best tips data analyst experts recommend to bridge the gap between technical execution and strategic decision-making. Whether you are just starting your journey or looking to refine your expertise, mastering the right mix of technical proficiency and soft skills is the key to longevity in this field.
The demand for data-savvy professionals shows no signs of slowing down. According to the U.S. Bureau of Labor Statistics, employment for data-related roles is projected to grow significantly faster than the average for all occupations through 2032. To stay competitive, you must adopt a mindset of continuous improvement and practical application. This guide provides comprehensive, actionable insights to help you navigate data complexities, communicate findings effectively, and accelerate your career trajectory.
Table of Contents
- 1. Strengthening Your Technical Foundation
- 2. The Art of Asking the Right Questions
- 3. Mastering the Data Cleaning Process
- 4. Data Visualization and Storytelling
- 5. Developing Deep Business Acumen
- 6. Tips for Data Analysts to Streamline Workflow
- 7. Building a Standout Portfolio
- 8. Future-Proofing with AI and Automation
- Conclusion and Key Takeaways
1. Strengthening Your Technical Foundation
To be effective, every data analyst must have a robust toolbox. While the specific software may vary by company, certain core technologies remain universal. Understanding these is the first step toward becoming a sought-after professional in the industry.
Master SQL for Data Retrieval
Structured Query Language (SQL) is the bread and butter of data analysis. While Python and R are trendy, SQL is what you will use 80% of the time to pull data from databases. Focus on mastering Joins, CTEs (Common Table Expressions), and Window Functions to handle complex datasets efficiently.
Intermediate to Advanced Excel
Do not underestimate the power of Excel. Many stakeholders prefer reports in spreadsheet format. One of the most practical tips data analyst newcomers should follow is learning VLOOKUP, INDEX/MATCH, and pivot tables early on. It remains the fastest tool for quick-and-dirty data validation.
Programming with Python or R
For more advanced statistical analysis and automation, learning a programming language is essential. Python is generally recommended due to its versatility and the massive support of libraries like Pandas, NumPy, and Scikit-learn. R is excellent for academic and heavy statistical research.
2. The Art of Asking the Right Questions
Data analysis is not just about crunching numbers; it is about solving business problems. Before you even touch a dataset, you must understand the “why” behind the request. This distinguishes a technician from a true consultant.
“If I had an hour to solve a problem, I’d spend 55 minutes thinking about the problem and five minutes thinking about solutions.” — Albert Einstein
Always ask stakeholders: “What business decision will be made based on this data?” Understanding the end goal helps you filter out noise and focus on the metrics that actually matter. Without this clarity, you risk spending hours on an analysis that provides no actionable value.
3. Mastering the Data Cleaning Process
It is a well-known industry fact that data analysts spend approximately 60-80% of their time cleaning and organizing data. This phase is often tedious but is the most critical for ensuring accuracy. One of the best tips data analyst veterans give is to never trust your data at first sight.
Check for Missing Values and Outliers
Missing data can skew your results significantly. Determine if the missing values are random or if there is a systemic issue in data collection. Similarly, identify outliers and decide whether they represent genuine anomalies or errors in data entry.
Standardize Data Formats
Ensure that dates, currencies, and naming conventions are consistent across all tables. Inconsistencies like “US,” “USA,” and “United States” can ruin your aggregations. Automated scripts in Python or SQL can help standardize these fields quickly across large datasets.
4. Data Visualization and Storytelling
Your analysis is only as good as your ability to communicate it. Complex charts might look impressive, but simplicity is often more effective. Your goal is to lead the audience to a conclusion without them having to work for it.
Choose the Right Visualization
Don’t use a pie chart for 15 categories. Use bar charts for comparisons, line charts for trends over time, and scatter plots to show relationships between variables. Keep your visualizations clean by removing unnecessary gridlines and labels that distract from the main message.
The Power of the Narrative
When presenting, follow a narrative arc: context, the problem, the data evidence, and the recommendation. Framing your data within a story makes it memorable and persuasive. This is a top-tier tips data analyst skill that leads to promotions and leadership roles.
5. Developing Deep Business Acumen
A data analyst who doesn’t understand the business is just a calculator. You need to know how the company makes money, who the customers are, and what the current industry trends look like. This context allows you to spot trends that others might miss.
If you work in e-commerce, understand metrics like Customer Acquisition Cost (CAC) and Lifetime Value (LTV). If you are in SaaS, focus on Churn Rate and Monthly Recurring Revenue (MRR). Aligning your technical output with these business KPIs makes your work indispensable.
6. Tips for Data Analysts to Streamline Workflow
Efficiency is key to avoiding burnout. As you progress, you should look for ways to automate repetitive tasks. This frees up time for the creative and strategic parts of your job.
- Document Your Code: Always comment on your SQL queries and Python scripts. This saves hours of frustration when you have to revisit a project months later.
- Build Templates: Create reusable templates for common reports and dashboards in Power BI or Tableau.
- Version Control: Use Git or similar tools to track changes in your analysis scripts. This prevents the nightmare of having twelve files named “Final_Analysis_v12_v2.xlsx”.
7. Building a Standout Portfolio
In the competitive job market, showing is better than telling. A portfolio proves you can handle real-world messy data. Avoid using generic datasets like the Titanic or Iris datasets, as recruiters have seen those thousands of times.
Instead, find a dataset related to a personal hobby—like sports, music, or finance—or scrape your own data. This shows initiative and passion. Document the entire process, from data cleaning to final insights, and host it on GitHub or a personal website.
Ready to start your journey?
Download our comprehensive Data Analyst Career Roadmap to guide your learning.
8. Future-Proofing with AI and Automation
The rise of Generative AI is changing the landscape of data analysis. Instead of fearing it, you should embrace it. Tools like ChatGPT and GitHub Copilot can help you write SQL queries faster or debug Python code in seconds.
Focus on becoming an “AI-augmented” analyst. Learn how to use LLMs to generate hypotheses, summarize findings, or explain complex statistical concepts to non-technical stakeholders. However, always verify AI-generated work, as “hallucinations” are a real risk in data precision.
Conclusion and Key Takeaways
Becoming an elite data professional is a marathon, not a sprint. By implementing these tips data analyst experts use every day, you will move beyond simple reporting and become a strategic partner in your organization. Remember that while technical tools change, the ability to think critically and communicate clearly is timeless.
Key Takeaways:
- Prioritize SQL: Learn it deeply; it is the foundation of data accessibility.
- Embrace Data Cleaning: See it as an opportunity to understand the data’s nuances, not a chore.
- Tell a Story: Don’t just show charts; explain what they mean for the business.
- Automate: Use Python and AI to handle repetitive tasks and focus on high-value analysis.
- Stay Curious: The best analysts are the ones who never stop asking “why.”
Start applying one of these tips today. Whether it’s refining an old SQL query or practicing a presentation, small consistent improvements lead to massive career growth over time. The world of data is vast—make your mark on it with precision and purpose.